A new approach to dust monitoring is starting to spread throughout the industrial hygiene field. It is the use of a device that simultaneously does real-time direct reading combined with standard method in a compact wearable product. The beauty of this type of device is three-fold.
First, there is only a single compact device that the worker has to wear to do both methods of monitoring.
Second, since all monitoring is done in one pass you do not have to send out someone with a portable meter to do the real-time monitoring.
Third, the dust is being sampled from the breathing zone is simultaneously used for both the real-time and the standard method which means 100 percent correlation of results is guaranteed because it is the same dust.
Last, the real-time results can be instantaneously used to identify and pinpoint sources of concern for the workers. I have even seen people use a camera on the workers to get visual correlation with the real-time dust monitoring data.
Real-life example
Our example is a glass-making operation that uses raw silica that comes in bags and then makes specialty glass products. For workplace assessment purposes the worker in the silica bagging area and the worker in the glass manufacturing area have on the wearable device for their full eight-hour shift.
At the start of the day, the industrial hygienist prepares for testing by connecting the two devices to be used to a PC and setting up the test parameters for the day. The IH also purges and zeros the unit with a HEPA filter before putting in the pre-weighed cassette with the sample filter in it.
Then the IH puts the units on the belt of the worker and runs the tube to the breathing zone and clips it within eight inches of the worker’s mouth. The worker goes to the shift work and the IH goes back to the PC and starts the test and checks to see that the data is coming from the unit.
Throughout the day, the worker will hear or see an alarm if a dangerous condition occurs or if the device has any issues. The IH will also see the alarm on the screen. A real-time graph on the IH’s PC shows the progress of the testing and allows the IH to take action if dangerous situations occur and to anticipate danger is the trend on the graph is moving in that direction.
At the end of the shift the test automatically shuts off and the IH can get the units from the workers, shut them off, and then close off the test. The IH removes the sample cassette and bags it to send it to the lab for gravimetric, XRD, or IR testing. Note that once correlation between the direct-reading results and the post-sample gravimetric analysis has been done the lab testing is no longer necessary and the real-time meter results can be used directly at the end of the shift.
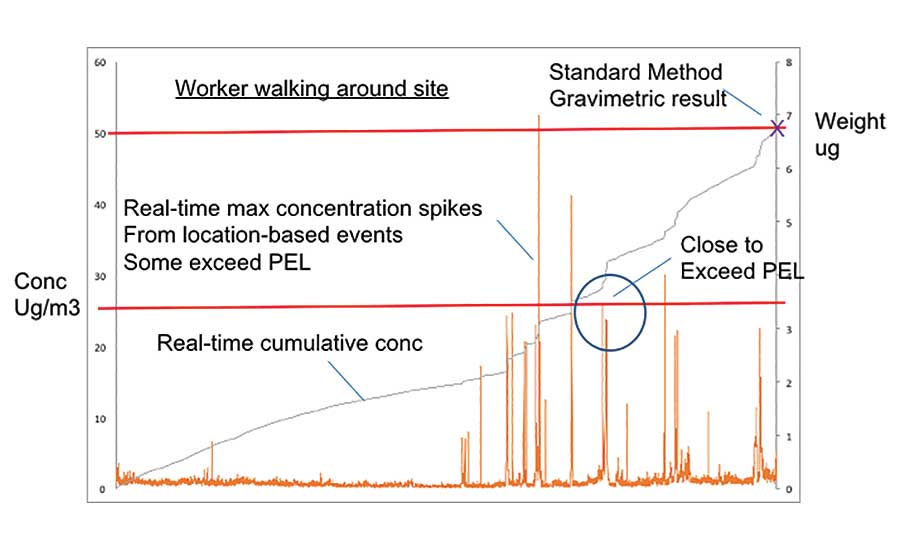
In the glass factory, the worker is moving around and encountering various danger zones. This can be seen on the graph pictured as spikes in the dust concentration at certain times of the day. These have been correlated to specific areas in the manufacturing plant, and now that the level and location is known suitable containment can be designed.
On the graph, the average concentration is seen to be building throughout the shift and at the end of the shift it has reached a level that is lower than the new PEL for silica. With the digital data it is possible to look at specific instances and investigate them closer.
Gravimetric analysis
The next step in the process is to send out the sample for Gravimetric analysis (NIOSH 0600). Gravimetric analysis is necessary to test for standard method to officially verify if the permissible exposure limit has been exceeded on the shift or not. Whenever this is done the results should be compared with the direct-reading result to ensure that the dust monitor direct-reading results are correlated with the standard method. The results of the comparison can be fed back into the device to adjust the mass concentration reading to increase the accuracy of the device.
The next step is to use XRD (NIOSH 7500) or IR Absorption (NIOSH 7603) to determine the percentage of the dust to be measured in the sample and adjust the direct-reading device to make it more accurate. For example, if the sample contains 56 percent crystalline silica, then the device can be adjusted to show only 56 percent of the dust found.
The silica bagging operation results show that bagging is done near the end of the shift to prepare for next days operation. Two spikes from silica pours show up in the afternoon.
This part of the operation is considered high danger and workers must wear suitable protection the whole time they are in the bagging rooms. The results from this worker show the high level of silica dust ambient in the room and even higher level.
There is one additional benefit of the real-time direct-reading devices. When training workers it is very powerful to let them see the spikes on the graph, in real time, when they enter dangerous areas. That provides a lasting impression that helps teach them to be careful.
Finally, the moist important aspect of using the direct-reading devices along with the standard method is now the IH manager has lots of data to be able to use when demonstrating dangers in the operation and getting focus on solving any issues.