
|
| Figure 1 |
We’ll do this by reviewing the basic phases of an SMS process, as described to me by the safety manager of a location that was awarded the highest safety rating across his $27 billion company’s global operations, and how such a process can be supported by advanced and predictive analytics.
Phase 1: Job Hazard Analysis (JHA)
In this stage, all significant hazards associated with the work that needs to be completed are identified and documented via a Job Hazard Analysis (JHA). This can be done at an individual task or project level (e.g. manufacturing a widget), or even a facility or company level (e.g. manufacturing 100 million widgets per year across one or several manufacturing locations).
Ideally, this phase is accomplished with a cross-functional team representing frontline employees and managers from both operations and safety. However, the knowledge of even the smartest team is limited by their own experiences, and what they have read or been told. This is where advanced analytics can first support the SMS process.
What if we could augment this team’s knowledge with the knowledge from every JHA ever created? Or every article or journal report ever written about job hazards, and every incident related to the specific work task being considered, and every relevant safety audit or inspection, and on and on. While no human being could possibly process such a large store of information, computers can and are doing this today.
Advanced analytics research has shown that one hazard associated with jobsites is when the inspection team is comprised only of safety professionals. When this occurs, higher incident rates result. This is not an intuitive finding that would generally be recognized as a hazard in a standard JHA process. This requires machine analytics of a statistically significant dataset (in this case millions of data points) to see this pattern and identify this hazard. Once identified, risk management plans (see the next phase of an SMS process) for this hazard can be developed. In this case, ensure that the organization’s inspector group includes all functions within the company, and not just safety.
Phase 2: Risk Management
Plan and Training
In this stage, each significant hazard identified in the JHA developed in Phase 1 is managed by executing various Risk Management Plans. These plans might consist of building Standard Operating Procedures (SOP’s), which detail how to execute the work activities in the safest manner, or they may include engineering safety mechanisms into the production process, or they may include procuring personal protective equipment (PPE) to protect workers from hazards. Regardless of what these plans entail, they must be written down and formalized so that measurable goals and objectives can be aligned with them to drive accountability. In addition, these plans must be clearly communicated to the organization, generally in some form of formalized training, to drive both understanding of the job hazards and how to manage them, as well as personal accountability for working safely.
How can advanced analytics help in this phase? Similar to the way described in phase 1. We can augment the knowledge of our risk management team with the knowledge derived from computers that can process nearly limitless amounts of information.
Phase 3: Safety Inspections and Observations
The least costly and most proactive way to test the effectiveness of your JHA and Risk Management phases is for employees to inspect and observe daily work activity to ensure that it is in compliance with the key components of the Risk Management Plan (from phase 2) and thus is effectively managing the workplace hazards.
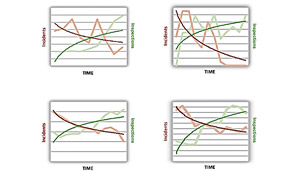
Research has shown that increased inspection and observation rates can help drive down incident rates. The data companies compile from these inspections fuel predictive analytics yielding leading indicators that predict injuries before they occur. Once predicted, these incidents can be prevented. Figure 2 shows four actual jobsites that effectively reduced their incident rate (the red lines) by increasing their use of inspection data to fuel their predictive analytics systems (the green line).
Phase 4: Incident Analysis
This is another phase where advanced analytics has proven quite effective. Many organizations have reduced their incident rate by analyzing their past incidents for root causes and opportunities for improved risk management measures. However, there are three issues with relying on this type of analysis. First, it is costly to wait for incidents to occur before preventing new ones. Second, it sends a chilling message to your employees. Basically, an organization is saying, “Jim, I am going to wait until your arm gets severed in our production line so that I learn from that incident and prevent Susan’s arm from getting severed. In the meantime, work safe, and keep that assembly line humming. We have production goals to hit!” Finally, as you improve at reducing incidents, you run out of statistically significant data sets to analyze. This is a good thing. However, at that point, you MUST turn to other predictive analytics methods (see phases 1-3 above) to keep your workers safe.
Phase 5: Recognition and Accountability
Generally, there are three levels of accountability in this final phase: 1) individual accountability, 2) leadership accountability, and 3) system accountability. First, the individuals who are successfully executing the Risk Management Plans to address their workplace hazards are recognized for their achievements. Those who are not, are held accountable as appropriate. Second, leadership must be engaged and accountable. They must fully support the SMS process by properly funding it, resourcing it and constantly communicating its importance — as well as holding themselves personally accountable within it.
Finally, the SMS process itself must be periodically audited to ensure that it is achieving its goal and objectives. Through this SMS process review, generally an audit, you can a) measure its effectiveness and b) trend the data that the SMS process throws off, to do further advanced and predictive analytics, similar to those described in phases 1-4 above. You can start analyzing correlated data elements from the entire SMS process and identify trends that not only reduce incidents in the short term, but also ensure that your SMS process is optimized over the long term, ensuring that future hazards are effectively managed.
Both SMS processes and predictive analytics are important ways to reduce workplace injuries. Many companies that employ both are achieving world-class results. They are moving the industry forward by providing even more data that can be used to fuel the advanced analytics functionality of tomorrow. The results of this analysis will further inform SMS processes, creating a virtuous cycle of continuous improvement and reduced incident rates.


