 There was a dramatic increase in obesity in the United States from 1990 through 2010, according to the U.S. Centers for Disease Control and Prevention (CDC), which has released a new map detailing the obesity prevalence state-by-state.
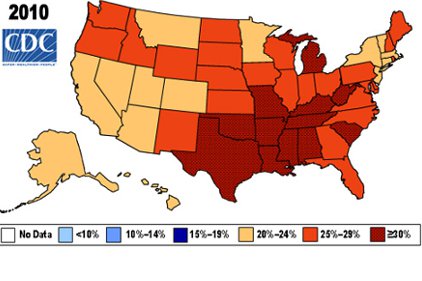
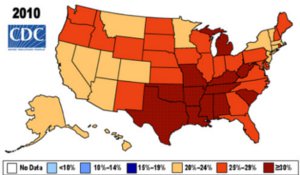
The map, based on Behavioral Risk Factor Surveillance System (BRFSS) data, uses color coding to illustrate state estimates ranging from 20.7 percent in Colorado to 34.9 percent in Mississippi. No state had a prevalence of adult obesity less than 20 percent, and 12 states (Alabama, Arkansas, Indiana, Kentucky, Louisiana, Michigan, Mississippi, Missouri, Oklahoma, South Carolina, Texas, and West Virginia) had a prevalence of 30 percent or more.
The South had the highest prevalence of adult obesity (29.5 percent), followed by the Midwest (29 percent), the Northeast (25.3 percent) and the West (24.3 percent).
No state met the nation's Healthy People 2010 goal to lower obesity prevalence to 15%. Instead, the changes went in the opposite direction: in 2000, no state had an obesity prevalence of 30% or more while in 2010, 12 states had an obesity prevalence of 30%.
For more information visit the CDC webpage: Obesity and Overweight.


