Want to grab a manager's attention?
Key to this presentation was the need to speak the language of senior management, not health and safety jargon. There was no reference to things like TIR, LWDC rates and the like - just dollars, profit margins and sales. Like it or not, this is the language of senior management and we need to speak in that language.
I explained that in the previous year our workers' comp costs were $11 million. Now, was the senior management of a $25-billion company really interested in hearing some staff guy talk about $11 million?
Not at all.
Above average
I proceeded to mention that through benchmarking we knew we were four to eight times better than our competition. Now they started to listen. "Competition" is a term near and dear to them.I went on to state that if our workers' comp costs were average - that is six times greater - they would total $66 million. That still didn't get their collective attention.
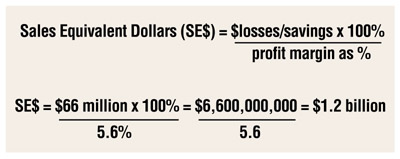
I then mentioned our profit margin was 5.6 percent, to which they nodded agreement. Next I said, "Do your realize that if we were average we would have to generate an additional $1.2 billion in sales to make up just for the workers' comp costs? At that point I knew I had their collective attention, and a few questioned how I arrived at this number.
Senior managers can clearly relate to this metric I first used in 1992 called Sales Equivalent Dollars. Throughout this article I'll refer to it as "SE$." The formula is simple, straightforward and defensible. You want no smoke and mirrors when communicating with senior management.
The formula
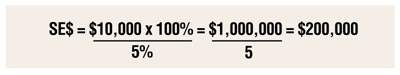
I expected skepticism after my presentation and was prepared to go over the formula and calculation as shown in Formula 1 (above).You don't have to deal in millions for this approach to make business sense. Formula 2 depicts a $10,000 loss or savings in terms of SE$ and a profit margin of five percent.
Said another way, $10,000 in either losses or savings represents an equivalent of $200,000 in additional sales.
No smoke & mirrors
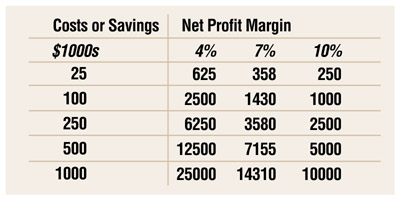
Below is a chart (Table 1) showing this relationship using various costs/savings amounts and profit margins. If you don't know your company's profit margin, just pick one or two close to what you expect it to be. Your senior management will get the picture.No doubt we have all seen the iceberg illustration that shows the well-understood phenomenon that the indirect costs (below the water line) are several times greater than the direct costs (above the water line). This concept is typically quantified by statements such as, "Indirect costs are 5-50 times direct costs."
If I would have tried to apply even the 5X multiplier in my presentation I would have most likely lost credibility since I couldn't back this up with hard data. But, if the "Archives of Internal Medicine" article titled, Occupational Injury and Illnesses in the United States (July 28, 1997, pp. 1557-1568) had been published when I gave my presentation I would have used a 2X multiplier in my example and restated the SE$ to be $2.4 billion.
This article, on page 1563, describes a large study that tabulated both the direct and indirect costs. Although the authors did not speak directly to an indirect cost multiplier, one could easily be calculated from their data. It came out to be 1.955, which I rounded out to be 2X. Now a 2X multiplier won't inflate indirect costs like a 5-50X one would, but it can be documented and is credible - both extremely important when dealing with senior management.
New safety metric
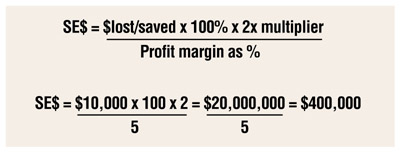
Let's revisit my formula and now multiply the direct costs by two to determine the total costs, encompassing both direct and indirect costs. So going back to the $10,000 example, this is depicted in Formula 3.
So the $10,000 now represents a non-controvertible equivalent sales of $400,000.
Development & deployment
It's not necessary to eliminate any of the safety metrics you are now using. Instead, develop the data you need to calculate SE$ and gradually integrate it into your process of communicating results. Or you could choose a more direct approach such as I did and meet directly with your senior management to discuss the business case of health and safety in terms of SE$.This concept is equally applicable if your enterprise is better than average, average or below average. You simple need to frame the opportunities accordingly. For example, if your costs are greater than what you suspect is average, use this approach to demonstrate the SE$ that can be realized by cutting your injury/illness rate or workers' comp costs by a third or a half.
If real progress is to be made on the business side of health and safety we need to start talking in the language of senior management. There are many ways to do this, but one of the simplest and most straightforward is to express health and safety losses/savings as SE$.
Looking for a reprint of this article?
From high-res PDFs to custom plaques, order your copy today!


