How are we doing?
We put lots of resources into hearing conservation
programs (HCP) — hearing protection,
hearing testing, training, noise control, and
lots more. What are we getting for our investment?
While OSHA requires a “continuing, effective” HCP, there has been little guidance as to what that means or how to measure it. Other than a 1985 letter of interpretation (http://www.osha. gov/pls/oshaweb/owadisp.show_document?p_ table=INTERPRETATIONS&p_id=1929), OSHA has been quiet about what constitutes an effective HCP or how to measure it.
Most HCPs, if they are assessed at all, are measured using the lagging indicator of hearing loss. OSHA’s revision of 29CFR1904.10, the aspect of the recordkeeping rule that pertains to recording hearing loss on Form 300, gave clear direction as to what qualifies as a “recordable event.” But reliance on hearing loss as the measure of HCP effectiveness is too late. By definition, the combination of standard threshold shift (STS) and the 25 dB “fence” that qualifies as a recordable reflects hearing impairment — if all we measure is impairment — we are missing the opportunity to prevent hearing loss.
Even using STS as a primary measure of HCP effectiveness is too late. The age-corrected, frequency- averaged nature of STS means that by the time a worker shows this amount of hearing loss, it could be too late to intervene to prevent damage.
This checklist delves a little deeper into program management by assessing attitudes and culture, and providing a brief background and rationale for each set of audit questions. The checklist is available at http:// www.cdc.gov/niosh/topics/noise/solutions/ hearingchecklist.html.
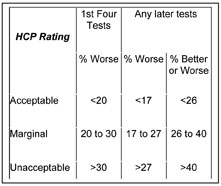
ANSI S12.13TR – 2002 uses a measure of internal variability of hearing test findings as a surrogate for program effectiveness. By comparing audiograms on a fixed group of people year to year (year 1 to year 2; year 2 to year 3; etc.) and assessing the stability of hearing tests, a picture of the quality and integrity of the hearing testing process becomes clear. The metric used for this analysis — a 15 dB change, better or worse, frequency specific, in either ear — was selected to reflect the standard-writers’ view of the reality of hearing testing in industry. While there may be questions about an HCP with up to 40 percent of hearing tests showing significant variability being described as “marginal,” (see Figure 2 above) the overall approach addresses the viability and reliability of the hearing testing aspect of the HCP.
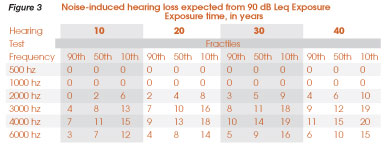
Another performance measure is indirectly described in ANSI S3.44-1996 (R2006) and its international corollary, ISO 1999. This standard describes the hearing threshold levels that would be expected in a population with a given noise exposure for a given period of time, at the 10th, 50th, and 90th percentiles. (See Figure 3 below) Comparing the average hearing ability of an internal population with this reference group can be an indication of how well hearing protectors and the HCP are protecting workers.
As an example of how this could work, NIOSH used a database like this in work with carpenters. They found the average 25-year-old carpenter in their analysis had the hearing ability of a 50-year-old who had not been exposed to noise. A pretty powerful statement, especially for that 25-year-old carpenter!
ANSI standards related to noise and acoustics are available from the Acoustical Society of America at http://webstore.ansi.org/.
To compare local performance to industry subsectors, start by determining the NAICS classification of interest at http://www.census.gov/ eos/www/naics/. Look up hearing loss cases and prevalence at http://www.bls.gov/iif/oshwc/osh/ os/ostb1911.pdf, and compare to local metrics.
While OSHA requires a “continuing, effective” HCP, there has been little guidance as to what that means or how to measure it. Other than a 1985 letter of interpretation (http://www.osha. gov/pls/oshaweb/owadisp.show_document?p_ table=INTERPRETATIONS&p_id=1929), OSHA has been quiet about what constitutes an effective HCP or how to measure it.
Most HCPs, if they are assessed at all, are measured using the lagging indicator of hearing loss. OSHA’s revision of 29CFR1904.10, the aspect of the recordkeeping rule that pertains to recording hearing loss on Form 300, gave clear direction as to what qualifies as a “recordable event.” But reliance on hearing loss as the measure of HCP effectiveness is too late. By definition, the combination of standard threshold shift (STS) and the 25 dB “fence” that qualifies as a recordable reflects hearing impairment — if all we measure is impairment — we are missing the opportunity to prevent hearing loss.
Even using STS as a primary measure of HCP effectiveness is too late. The age-corrected, frequency- averaged nature of STS means that by the time a worker shows this amount of hearing loss, it could be too late to intervene to prevent damage.
Figure 1
Systems measurement
Other approaches to HCP assessment can do a better job of preventing hearing loss.- Audits: This approach assesses the presence, and sometimes the integrity, of program components.
- Performance measures: These are arbitrary, freestanding markers that compare local HCP performance to specific performance standards.
- Benchmarking is the comparison of local program performance to a peer group — for example, in the same industry.
- Trends: Looking at changes in conditions within the HCP over time can provide useful information about the direction of the program.
Figure 2
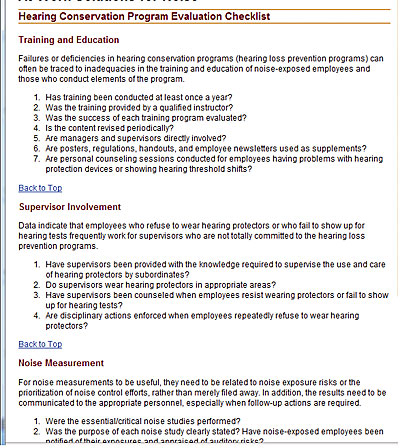
Audits
Many facilities use audits to provide a general compliance assessment for various programs. NIOSH has developed a tool specific to HCPs that tests the integrity and presence of key program components. (See Figure 1)This checklist delves a little deeper into program management by assessing attitudes and culture, and providing a brief background and rationale for each set of audit questions. The checklist is available at http:// www.cdc.gov/niosh/topics/noise/solutions/ hearingchecklist.html.
Figure 3
Performance measures
A range of performance measures is available to help assess HCP effectiveness. Each can be useful, but each has limitations.ANSI S12.13TR – 2002 uses a measure of internal variability of hearing test findings as a surrogate for program effectiveness. By comparing audiograms on a fixed group of people year to year (year 1 to year 2; year 2 to year 3; etc.) and assessing the stability of hearing tests, a picture of the quality and integrity of the hearing testing process becomes clear. The metric used for this analysis — a 15 dB change, better or worse, frequency specific, in either ear — was selected to reflect the standard-writers’ view of the reality of hearing testing in industry. While there may be questions about an HCP with up to 40 percent of hearing tests showing significant variability being described as “marginal,” (see Figure 2 above) the overall approach addresses the viability and reliability of the hearing testing aspect of the HCP.
Another performance measure is indirectly described in ANSI S3.44-1996 (R2006) and its international corollary, ISO 1999. This standard describes the hearing threshold levels that would be expected in a population with a given noise exposure for a given period of time, at the 10th, 50th, and 90th percentiles. (See Figure 3 below) Comparing the average hearing ability of an internal population with this reference group can be an indication of how well hearing protectors and the HCP are protecting workers.
As an example of how this could work, NIOSH used a database like this in work with carpenters. They found the average 25-year-old carpenter in their analysis had the hearing ability of a 50-year-old who had not been exposed to noise. A pretty powerful statement, especially for that 25-year-old carpenter!
ANSI standards related to noise and acoustics are available from the Acoustical Society of America at http://webstore.ansi.org/.
Benchmarking
OSHA and the Bureau of Labor Statistics (BLS) collect information on workplace injuries and illnesses on Form 300. The information that is eventually reported is generated from a secondary survey of selected locations rather than a summary of all Form 300 reports (see http://www.bls.gov/iif/home.htm for details). The annual Injury and Illness Report then provides a benchmark of HCP performance for primary North American Industry Classification System (NAICS) codes. NAICS is a replacement for SIC code, and uses a scheme of major industry-to-subset.To compare local performance to industry subsectors, start by determining the NAICS classification of interest at http://www.census.gov/ eos/www/naics/. Look up hearing loss cases and prevalence at http://www.bls.gov/iif/oshwc/osh/ os/ostb1911.pdf, and compare to local metrics.
Other tools
Simple internal analyses can help as well:- How many audiograms were given compared to the number of workers exposed? If not all noise-exposed workers are receiving hearing tests, it could bring the reliability of any hearing-test related measure of program effectiveness into question.
- Are pre-STS conditions measured in the HCP? Some facilities use non-age corrected STS or other “early warnings” to identify people for intervention before hearing loss becomes a recordable issue.
- Field fit-testing of hearing protection devices (HPD) is becoming a viable tool for assessing the effectiveness of HPD selection, fitting and training.
Looking for a reprint of this article?
From high-res PDFs to custom plaques, order your copy today!


