Editorial
Roofers, linemen, oil and gas workers among top 10 most dangerous jobs
Every year, AdvisorSmith researches the most dangerous jobs in the United States based on data from the U.S. Bureau of Labor Statistics Census of Fatal Occupational Injuries. The list doesn’t usually vary by too much, but there are some statistics worth a second look in the current list, which uses data from 2014-2018.
Let’s start with the basics: The study looked at professions with minimum employment of 50,000 workers to find the 25 most dangerous jobs among 263 total professions in the study. The fatality rate was normalized by adjusting the number of fatalities by employment in each profession.
Rising fatalities
Unfortunately, on-the-job deaths have been rising in recent years, rising from 4,821 in 2014 to 5,250 deaths in 2018, an increase of 9 percent over the 5-year period. However, the rate of deaths adjusted for employment has only risen approximately 2.2% over the same period, as an improving economy has led to additional employment. In 2018, the average fatality rate among all jobs was 3.4 per 100,000 workers.
The AdvisorSmith study found that some jobs are significantly more dangerous than others. The most dangerous job, logging, was 33 times more dangerous than the average job nationwide. Additionally, many of the most dangerous jobs earn average salaries that are below the May 2019 annual mean wage of $53,490. Companies that hire workers with the most dangerous jobs usually have workers’ compensation insurance premiums that are higher than average.
The study also found that self-employed workers were 3.3 times more likely to die on the job compared with hourly and salaried workers. Wage and salaried workers had an average fatality rate of 2.9 fatalities per 100,000 workers in 2018, while self-employed workers had an average fatality rate of 9.4 per 100,000 workers during the same period.
Highest-risk jobs
Likely not surprising to those in the safety industry, many common fatal accidents have to do with transportation and slips, trips and falls.
1. Logging workers
- Fatal injury rate: 111 per 100,000 workers
- Total deaths (2018): 56
- Most common fatal accidents: Contact with objects and equipment
2. Aircraft pilots and flight engineers
- Fatal injury rate: 53 per 100,000 workers
- Total deaths (2018): 70
- Most common fatal accidents: Transportation incidents
3. Derrick operators in oil, gas, and mining
- BLS Category: Derrick, rotary drill, and service unit operators, oil, gas, and mining
- Fatal injury rate: 46 per 100,000 workers
- Total deaths (2018): 20
- Most common fatal accidents: Transportation incidents, contact with objects and equipment
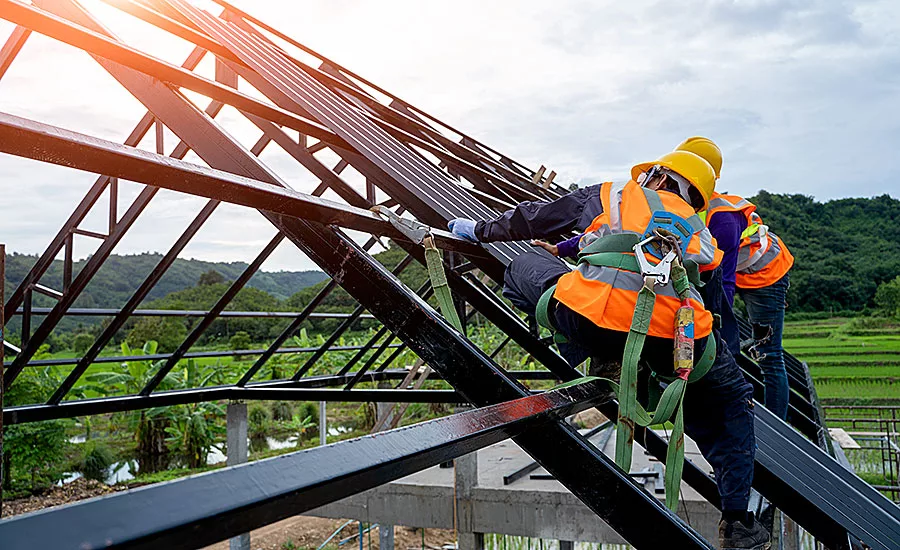
4. Roofers
- Fatal injury rate: 41 per 100,000 workers
- Total deaths (2018): 96
- Most common fatal accidents: Falls, slips, trips
5. Garbage collectors
- BLS Category: Refuse and recyclable material collectors
- Fatal injury rate: 34 per 100,000 workers
- Total deaths (2018): 37
- Most common fatal accidents: Transportation incidents
6. Ironworkers
- BLS Category: Structural iron and steel workers
- Fatal injury rate: 29 per 100,000 workers
- Total deaths (2018): 15
- Most common fatal accidents: Falls, slips, trips
7. Delivery drivers
- BLS Category: Driver/sales workers and truck drivers
- Fatal injury rate: 27 per 100,000 workers
- Total deaths (2018): 966
- Most common fatal accidents: Transportation incidents
8. Farmers
- BLS Category: Farmers, ranchers, and other agricultural managers
- Fatal injury rate: 26 per 100,000 workers
- Total deaths (2018): 257
- Most common fatal accidents: Transportation incidents
9. Firefighting supervisors
- BLS Category: First-line supervisors of fire fighting and prevention workers
- Fatal injury rate: 20 per 100,000 workers
- Total deaths (2018): 14
- Most common fatal accidents: Transportation incidents
10. Power linemen
- BLS Category: Electrical power-line installers and repairers
- Fatal injury rate: 20 per 100,000 workers
- Total deaths (2018): 29
- Most common fatal accidents: Exposure to harmful substances or environments
Farther down the list
Lower on the list, include crane operators, with a fatal injury rate of 19 per 100,000, and construction helpers, with a rate of 18 per 100,000. Construction helpers are construction workers who assist trade workers in the course of construction, and have a higher risk of death than the workers they are assisting.
Construction workers show up at No. 24 on the list at a fatal injury rate of 13 per 100,000 workers, and the most common cause of death for construction workers is falls.
Looking for a reprint of this article?
From high-res PDFs to custom plaques, order your copy today!


