Leading Safety
A scorecard for safety
Measurement and metrics are required for management to implement change

Credit: skynesher / E+ / Getty Image Plus
As a matter of practice, prior to 1992 all businesses measured their success based on financial (outcome) metrics alone. Kaplan & Norton wrote an article for the Jan-Feb 1992 issue of the Harvard Business Review Magazine titled “The Balanced Scorecard – Measures that drive Performance.” This completely changed the metrics businesses focused on as well as utilized in order to measure, improve and manage their performance and the resulting outcomes. Now, just about every business uses some form of the Balanced Scorecard in the management of their business. There are numerous short coming in traditional safety management in various industries, but more specifically in construction project delivery processes procedures and practices. Virtually all safety metrics are historic and almost all interventions are directed at their workforce.
Management is responsible as well as focused on efficient and effective operations. Specific information is required to manage and successfully accomplish this. The traditional financial measures used were historical, outcome metrics, which tell you how you have done in the past, but not much else. To manage effectively, management needs information that tells them in real time how well the organizational and operational systems are performing in order to meet business challenges, customer needs and expectations, incorporating innovative improvements, enhancing profitability as well as sustain growth. These require process metrics. Management also needs information on how quickly things are improving when they do implement a change. This requires progress metrics. To manage effectively all three of these metrics are useful as well as required.
Safety metrics
Organizations are required by law to keep track of their recordable accidents, with some exceptions. They are also required to provide that information to the Labor Department, who issue annual average injury and fatality statistics for various industries. Organizations can use this to gauge their comparative performance compared to others in their industry. Doing better than the industry average is not a very challenging target to strive to outperform.
Insurance companies who offer workers compensation policies track their insured’s, accidents and losses by a total number (frequency) and how costly they are (severity). This determines the premium they will charge for that policy in the upcoming year. Usually their loss control department (or the broker) may review these statistics and losses on an annual basis with their insured. They may offer suggested interventions so as to reduce the losses and therefore control the cost of the insurance policies going forward. But their statistics are also historical and do not provide significant operational interventions to come up with just-in-time solutions to underperforming issues.
Organizations may also keep track of accidents in a format that may assist them in trying to reduce the number as well as their severity in order to control their cost of risk as well as the resulting negative side effect accidents have on their production operations. All these revolve around outcome measures. The safety practitioner also conducts site inspection to initiate corrective action regarding any physical hazard or unsafe behavior. They investigate accidents and try to determine the cause and use that information to try to keep them from occurring again at some point in the future. But outcome metrics do not really provide specific actionable data or information for specific future process improvement initiatives.
Safety (or lack of safety) generally comes to management’s attention after an accident happens. Annually, safety will be discussed at the workers compensation insurance policy renewal. This may involve a review of accidents and their associated cost. So, the primary measurement of safety performance becomes loss statistics and their associated cost. This put safety into a cost or an expense disposition with a primary focus on cost cutting. This cost focus makes it difficult for safety personnel to get management to commit resources for possibly many of the potential safety improvement initiatives.
Safety and operational alignment
The biggest organizational disconnect is in the area of the alignment of safety with operations. One hears safety practitioners bemoaning their fate, complaining of not having any or little management support, sufficient resources, or the full backing of operational personnel. They also complain that it sometimes is challenging to have employees made available; or having sufficient time to receive required training or even needed retraining.
Safety personnel also see line management falling short in the implementation and execution of the safety processes and procedures. Safety metrics do not tell senior managers how the safety effort correlates to, and has the potential to enhance the organization’s operational processes. The organizational scorecard approach, if applied to safety, will more than likely provide the necessary alignment, and appropriate metrics that will resolve much of the issues and concerns that are seemingly difficult to overcome utilizing the traditional mean and methods.
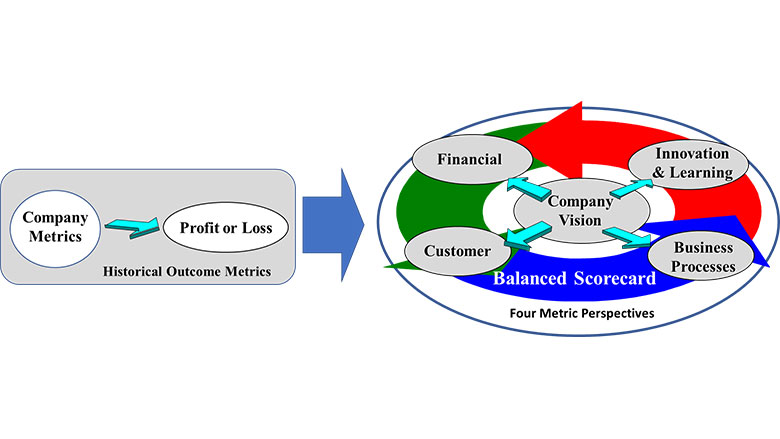
Figure provided by Peter Furst
Applying a scorecard to safety
So, how do we devise and utilize a scorecard for safety? If the business has implemented an organizational scorecard process, then a similar one for safety makes sense. If that is not the case then, the organization has to become creative and identify salient operational elements which will provide outcome, process and progress metrics for safety related elements or functions. The four business perspectives proposed by Dr. Kaplan:
- The customer perspective: Stakeholder in safety
- The internal business perspective: Safety Processes
- The innovation and learning perspective: Safety innovative tools or techniques
- The financial perspective: Safety outcomes
May be modified to be of value in devising potentially comparable safety scorecard elements which might be useful (see figure 2).
The stakeholder in safe work performance
Actually benefits just about everyone involved — the construction company, the project staff, the workforce, subcontractors, partners, suppliers, and even possibly vendors, others, as well as the owner. So, metrics which provide them with information regarding the effects of their efforts and how this benefits them as well as others will foster engagement, encourage involvement and benefit everyone involved in the project delivery process.
Safety processes and procedure
Everything that is done to make safety "work" properly and effectively: programs, training, audits, employee management, risk management, planning, organizing, communication, meeting, discussions, signage, support, tools, equipment, and the list goes on and on. Information on the extent of safety’s integration into operational processes, procedures and practices will foster greater alignment which will greatly affect safety improvement, while improving production and productivity as well as other operational benefits. So, the design of metrics which provide data whose analysis will result in improvement information which will benefit production, productivity, quality as well as safety.
Innovation in safety
Technological, work design, task demand, proactive and process innovation, knowledge improvement, skill enhancement, alignment and integration of operational systems with a safety focus, etc. will provide information on what needs improvement as well as how best to accomplish this.
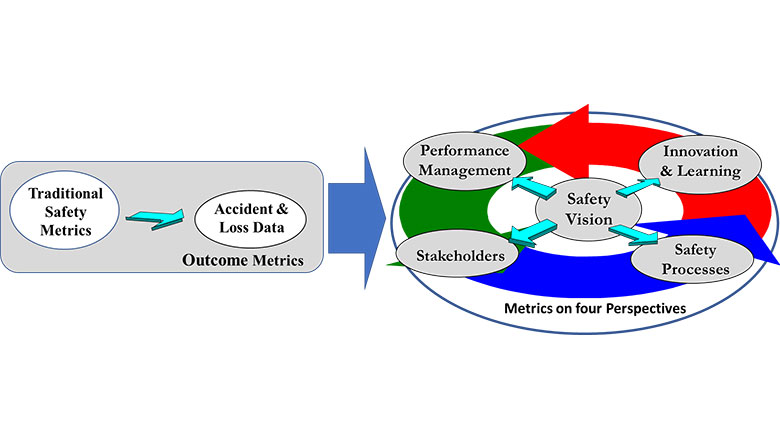
Figure provided by Peter Furst
Safety performance result
Operational excellence, leadership, worker empowerment and engagement, effective risk management, performance optimization while enhancing safety, performance measurement, management and improvement, etc. This area can be broadened to include the work climate. Of particular interest is the worker’s relationship with the supervisor (leader-member exchange) and crew dynamics, as well as the worker’s perception of the culture, values, and performance improvement.
The structure of the above scorecard reflects the original one proposed by the authors. Every organization must decide on the objectives of a scorecard which best “fits” that organization, and suites its goals and objectives.
So how do we go about accomplishing this? For example, assume that the vision we have for our safety effort is "an injury-free workplace." The next step is to identify strategies, objectives, measures, and targets for each of these perspectives. The organizational scorecard places vision and strategy at the center. This process establishes means and methods for the identification and remove of physical hazards, making the tasks safer and easier to perform.
If this is not possible then management looks to diminishing the identified risk’s adverse effect. Goals that will ensure everyone within the organization will benefit from actively engagement and adopt behaviors and take the actions that will achieve these goals. The measure is also designed to ensure this occurs and provides an assessment of how everyone is doing in progressing towards accomplishing the central vision. Senior management now has a process that effectively focuses all the efforts of the organization as well as operations toward the vision and a strategy which collects the information with which to improve operational efficiently and manage the work effectively as well as efficiently.
Conclusion
The benefit of a balanced scorecard is that the safety function becomes an integral part of operations, as well as its oversight and management. The organization may select any number of perspectives which they deem as important to their business or performance vision and strategy. They then collect data and use that information with which to drive excellence in operations fostering superior business results.
Looking for a reprint of this article?
From high-res PDFs to custom plaques, order your copy today!


