NASA's safety culture - Part Three: Widespread & systemic change
Data in various forms
The initiative began in the three pilot locations in mid-April of 2004. As the work progressed, various forms of data became available.Anecdotal data — Soon after implementation began we started hearing anecdotal evidence that the effort was having an effect. Some examples:
“I wasn't sure of this thing in the beginning. Now I am convinced that it will help us; we need to support it. I have invited observers to my meetings; I encourage you to do the same.†– Division Chief
“I found myself conducting my branch meetings and day-to-day interactions differently as part of this effort.†– Division Chief
Other examples:
Behavioral data — As data began to accumulate from the behavioral observation and feedback process, we started seeing improvement in the percentage of times that a critical behavior was observed being used, rather than observed as a missed opportunity.
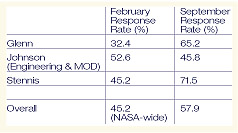
The BST Culture and Safety Climate Survey — Approximately six months after the start of the culture enhancement efforts, the safety climate and culture survey was re-administered to the groups where culture enhancement work had begun. The same survey from the initial assessment was used, as well as the same email-prompted, web-based administration method. At most locations the response rate exceeded the response rate obtained in the original (February 2004) survey administration (Table 1).
The Glenn Research Center and Stennis Space Center had survey scores during the initial assessment that were low compared to the NASA overall averages. The Johnson Space Center had scores that were high relative to the NASA average.
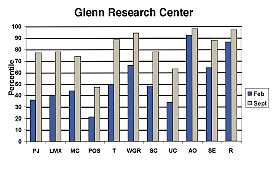
Glenn Research Center and Stennis Space Center results
All scales on the basic Safety Climate and Culture survey showed improvement at the Glenn Research Center (GRC). These results are shown in Figure 1. The September results (after intervention) show significant improvement over the February results (pre-intervention.)Comparing managers’ responses to non-managers’ responses, we found that there was greater change in survey scale results among managers than among non-managers. This is consistent with what we would expect after just six months: the culture enhancement strategy worked with leadership as the mechanism for driving culture enhancement, and initial activity was focused primarily on managers at all levels.
Results from the Stennis Space Center were very similar to those from GRC. All survey scores improved, and comments were consistent with these results.
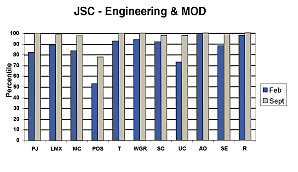
Johnson Space Center
The survey was administered at JSC to the Engineering Directorate and the Mission Operations Directorate, the two groups within JSC where culture strengthening efforts were focused.All scales on the survey showed improvement for these two JSC organizational units. Results are shown in Figure 2. The September results show significant improvement over the February results.
JSC had generally high scores on most scales prior to the culture change efforts. In the survey conducted after the initial efforts, every scale showed some level of improvement.
Comparing managers’ responses to non-managers’ responses, we again found that there was greater change in survey scale results among managers than among non-managers. As noted in discussing the GRC results, this was consistent with what we would expect.
As would be expected in the early stages of a major change effort, comments indicate that there appears to be a segment of the population that is seeing positive change and is optimistic about the direction the organization is moving, and another segment that is skeptical. But overall perceptions, measured by the survey scores, indicate that there is solid movement in the desired direction.
Looking for a reprint of this article?
From high-res PDFs to custom plaques, order your copy today!


