TRAINING STRATEGIES: Stop begging employees for observations

Our cumulative experience with thousands of locations has resulted in 50 million safety observations and 20,000 studies of industrial incidents and injuries. These have produced overwhelming evidence that behavior-based safety (BBS) principles are effective at reducing incidents and creating a better safety culture.
This article goes a step further than ordinary discussions of behavior-based safety by suggesting two ways organizations can enhance their existing BBS processes: 1) develop an objective way to measure the quality of an observation, and 2) tie your observations to your incidents. By engaging as many people as possible, ensuring committed leadership and using intelligent methods of safety observation, organizations can create a culture of discovery leading to continuous improvement.
If your leaders don’t trust your data…
Imagine two scenarios; one where the BBS observer has just finished conducting his observation and another where his manager is in the process of reviewing these observations.Observer: “I’m tired of collecting observations that no one does anything with. Why do I need to write this stuff down? It just wastes time in my already busy day.”
Manager: “I don’t know if I can trust these observations. Is it really possible that this group has not found a single at-risk behavior in over six weeks? What are we doing with all these observations anyway?”
This cycle of frustration repeats itself thousands of times daily in well-intentioned organizations. Over time, this leads to decreasing participation and observation quality with the result that you—the safety professional—must go back to begging employees to observe and pleading with managers to act.

Fig 1: Sample of an electronic “scorecard” for observers.
Develop a scorecard to evaluate safety observations
One way to stop this cycle is to develop a scorecard for the “quality” of your observations and to benchmark what a normal pattern of safe and at-risk behaviors should look like. This simple tool will have an enormous impact. First of all, it tells your leadership team what to expect and therefore, when and where to act. It also helps you, the safety professional, pinpoint specific observers or observation patterns that require further analysis.The best examples of observation quality incorporate the following criteria:
- The number of at-risk behaviors per observation card
- The number of safe behaviors per observation card
- The number of comments per observation card
- The number of medium or higher severity observations per observation card
You can combine these observation quality metrics, plus your participation metric, to compare one group against another. For example, take a group of your best observers (your process “champions” or employees you know to conduct thorough observations) and compare them to a random group of observers. Or, compare your safety professionals against your hourly workers. What is the average number of at-risk behaviors observed by each group? Compare the number of safes, number of comments, the severity of the behaviors observed and the average time between observations. Before you know it, a pattern will emerge. More importantly, you and your management team will know which observations you can objectively believe and which ones are suspect.
Tie your observations to loss
This improvement seems obvious, yet it is infrequently implemented. The most common reasons for failing to follow through include the perceptions that:- “It is too difficult.” In other words, the information lives in different systems, or there is no way to roll up the data in a timely basis.
- “The numbers do not make sense.” Observations are going up and incidents are either flat or also going up.
- “We don’t have any incidents to track against.” Some organizations record very few incidents, so no reliable analyses can be drawn.
Observation processes need to be flexible and must be tied to the desired end-result. When incident trends are not going down, and BBS observations are increasing or stable, then something may be broken in the observation process.
Some organizations have few incidents and therefore rely on leading indicators to help assess the health of their safety culture. One common leading indicator is near-misses. By tracking observations against near-misses, BBS practitioners can add a meaningful layer of analysis to assess whether risky behaviors observed correlate to reported near-misses.
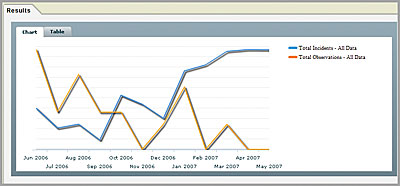
Fig 2: Technology enables you to establish the relationship between incidents and observations using one system.
Take advantage of available technology
You can address many of these challenges by using technology that tracks incidents and observations in the same place. Using such a system establishes the relationship between observations and loss information. It also provides the added benefit of continuing to help you monitor the progress of your BBS program as it evolves.Developing a way to measure the quality of observations and tying observations to incidents pays off in two ways. First, you can more efficiently assess the health of your safety process, thereby wasting less time demonstrating and sustaining a return on your BBS initiative. Second, by looking upstream and using your observations as leading indicators, you will grow more effective at lowering incident rates. Implementing these two initiatives will deliver meaningful and measurable results in 2009.
Looking for a reprint of this article?
From high-res PDFs to custom plaques, order your copy today!


