Surprises among list of most dangerous states to work in
Same occupations, different data
 Some states in the U.S. are far more dangerous for workers than others – but they are not necessarily the states where the most dangerous industries are based.
Writing in Time Magazine, Gary Belsky describes the surprisingly wide variation in workplace injuries rates from state to state – even within the same industries.
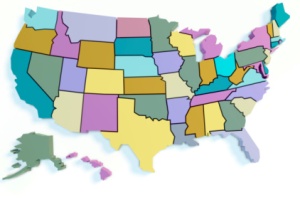
In a study from Allsup, a provider of Social Security Disability Insurance representation that’s based on 2011 data from the U.S. Department of Labor’s Bureau of Labor Statistics, the state with the highest number of serious injuries is Maine. With 1.4 injuries or illnesses involving job transfers or restrictions per 100 workers, Maine’s rate is twice the national average of 0.7 and 14 times as high as the least dangerous state, New York (whose rate is 0.1 cases)/
Most dangerous states for workers
1. Maine (1.4 injury/illness cases with job transfer/restriction per 100 workers)
2. Indiana (1.1)
3. California (1.0)
4. Connecticut, Kansas, Nevada, New Mexico, Oklahoma, Wisconsin, Alabama (0.9)
5. Iowa, Kentucky, Michigan, Missouri, Oregon, Pennsylvania, S. Carolina, Tennessee and Washington (0.8)
Least-dangerous states for workers
1. Arkansas, Illinois, Montana, Vermont, Virginia (0.6)
2. Maryland, New Jersey (0.5)
3. Alaska, Delaware, Massachusetts, West Virgina, Wyoming (0.4)
4. Louisiana (0.3)
5. Hawaii (0.2)
6. D.C., New York (0.1)
(Seven states—Arizona, Georgia, Minnesota, Nebraska, North Carolina, Texas and Utah—have rates that match the national average. For nine states—Colorado, Florida, Idaho, Ohio, Mississippi, New Hampshire, North Dakota, Rhode Island and South Dakota—there was no data available.)
Belsky explores the reasons behind the disparities and surprises, noting that Louisiana and Alaska, which have numerous workers employed in dangerous occupations like commercial fishing and the oil and gas industry, have below-average rates.
Maine and New York, at opposite ends of the injury rate spectrum, have about the same percentage of workers employed in white collar jobs: 38%.
Certain professions appear to be more dangerous in some states than in others. For example, serious injury ratesin automotive manufacturing were 3.5 in North Carolina but only 1.1 in Tennessee. Nurses working in Maine have a 7.1 cases per 100 workers serious injury/ illness rate, compared with the U.S. average of 1.5.
The national injury rate for slaughterhouse jobs is 3.1 per 100 workers, but in Oregon, it’s a whopping 8.3.
“More than likely, however, the disparity from state to state can be attributed to a pair of factors: taxonomy and environment,” writes Belsky. “The first, taxonomy, refers to inevitable differences in the way different states classify and report workplace-related injuries. That is, a sprained toe or respiratory trouble in, say, Indiana may be tagged or treated more cautiously than in, say, Hawaii. The second factor, environment, refers to the real and significant differences between, say, driving a tractor in Appalachia and Iowa; big hills are a lot trickier to navigate than great plains. So some of the differences in the Allsup study are undoubtedly meaningful, while others are not.”
Allsup conducted the study in order to highlight the prominence of workplace injuries, which are the sixth-leading cause of disability claims.
The company has ranked the 11 industries with the highest serious injury rates nationwide:
According to Allsup, here are the most dangerous jobs in the U.S.
1. Amusement parks/arcades (3.2 job transfer/restriction days per 100 workers)
2. Animal slaughtering/processing (3.1)
3. Beverage manufacturing (2.7)
3. Foundries
5. Nursing care facilities (2.6)
6. Beer/wine/distilled alcoholic beverage merchant wholesalers (2.4)
7. Motor vehicle body and trailer manufacturing (2.3)
8. Hog and pig farming (2.2)
8. Motor vehicle manufacturing
8. Community care facilities for the elderly
8. Poultry/egg production
Looking for a reprint of this article?
From high-res PDFs to custom plaques, order your copy today!


