The safety challenges of the 21st century require an integrative approach that brings fresh thinking and sound practices from across industries and among areas of safety specialization. Lessons from the personal and process safety approaches have revealed the strengths and weaknesses of each, but little has been done to bring them together. The current challenge is to create a safety approach that engages both process and personal safety and get better indictors for both process and personnel safety, especially in relation to oil well drilling sector
Occupational safety performance is often measured with frequency rates and severity rates of incidents based on personal injury such as lost-time injury frequency rate (LTIFR), (RWCFR), (MTOs) which appear a weak connection to major accident prevention. Numbers focus on consequences of incidents rather than causes, in addition it may be difficult for employees and their managers to see the connections between the effort they expand on safety and what is measured.
New indicators
Process safety indicator guidance published by a variety of organizations such as the American Petroleum Institute (API) in 2010 and the International Association of Oil and Gas Producers (2011) is sufficient to assist companies and regulators in preventing another Macondo type incident, given what we know about the causes of accidents. API RP 754 refers to the term “Process Safety Events” for its KPIs and includes both incidents involving loss of primary containment (LOPC) as well as challenges to the system barriers in place to prevent LOPCs.
There are four tiers of indicators presented in the form of a pyramid (Fig 1). At the top of the pyramid are losses of primary containment events of the greatest consequence. These are Tier 1 events. Tier 2 indicators are loss of containment events of less consequence than Tier 1. At the bottom of the pyramid are those managerial and operating aspects of operating a facility which, if successful, should contribute to a safe facility. These are Tier 3 and 4 indicators and are intended for internal use at individual sites. API 754 recommends that leading indicators are appropriate for these topics.
The focus on losses of containment, obviously a very important class of incident, does not cover all hazards during oil well drilling operations The semi-submersible accommodation barge, the Alexander Kielland, was lost in the North Sea in 1980 with the loss of 123 lives following a structural failure; the Ocean Ranger semisubmersible drilling rig sank offshore the Maritime Provinces of Canada in 1982 with the loss of 84 lives following ballast control problems. None of these disasters involved a loss of containment.
Organizational measures
To improve an organization’s approach to measuring personnel health and safety performance, a useful starting point is to include consideration of:
- Proactive measures percent adherence to target for proactive measures goal (eg % of operations covered by toolbox talk/JSA etc.) A proactive measure may be defined as those discretionary activities which are performed to plan, prepare, and execute operations safely and in an environmentally sound manner, including but not limited to JSA, safe observations, and safety meetings).
This point is particularly important because the choice of measures can sometimes promote behaviors which are in conflict with the desired outcomes. For example, rewarding low accident rates (in the absence of other measures of performance) can lead to under-reporting. Or merely counting the number of safety meetings held by a supervisor can lead to the target for the number of safety meetings being achieved but the quality being very poor. - Reporting near-miss events. A well-designed near-miss process includes: analysis of potential problems, determination of their causes, finding solutions and implementing them. Therefore, it perfectly fits into the category of proactive measures.
- Number of closed-out HSE action items as percentage of total for either company or contractor EHS-related audits, inspections & STOP tours performed in previous 12 months.
- Training and competency plan y e.g score 0 if there is no training or competency program in place. A score of 1 is achieved by the Contractor/rig having 100 percent of its crew actively participating in the program and 1 point for 100 percent promotions made with prior competency training complete.
To improve an organization’s approach to measuring process safety performance, a useful starting point is to include consideration of:
- Developing the barrier approach for drilling process safety based on the concept of identifying the barriers to or causes of a well related major incident appears to offer additional focus on process safety during oil well drilling operations.
- Establish an overview of the process safety concerns, trend the performance with continuation of reporting and improve the investigation to help establish the right remedial actions and prevent reoccurence
- Review of well process safety requirements include the following:
- Confirm well control equipment certification and validation
- Confirm well control test compliance
- Confirm well control equipment inventory
- Confirm personnel training certification compliance
- Ensure barrier verifications & compliance is well done.
- Follow standard and procedures
- Regularly test emergency response and conduct regular drills Implement
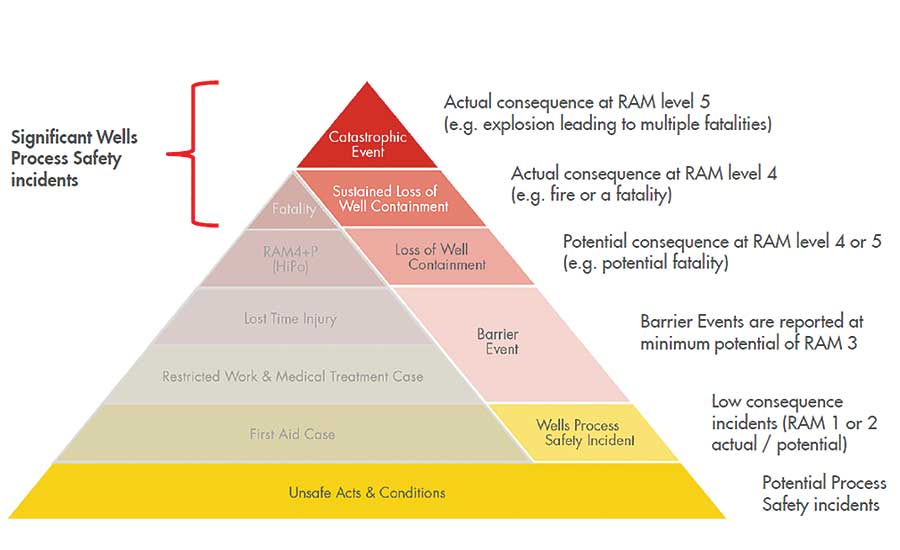
The pyramid shown at right (Fig 2) presents indicators in the form of a pyramid for both process and personnel safety. At the top of the pyramid are losses of primary containment events of the greatest consequence. At the bottom of pyramid are WELL PROCESS SAFETY INCIDENTS and BARRIER EVENT for process safety.
Wells Process Safety Incidents (WPSI) are defined as incidents or unsafe conditions that may result in, or have the potential to escalate to, loss of well control or impairment of wellbore integrity and include any actual or potential unplanned or uncontrolled release of well effluents from assets or facilities operated by wells.
WPSI may occur during design, construction, operating, maintenance and abandonment. Examples include failure of the BOP system, well control situations, inaccurate pore pressure prediction, hydrocarbon leaks from pressure control equipment, mud return alarms disabled, and inadvertent closure of BOPs.
Barrier Events are defined as non-compliances with the requirement that all well operations SHALL be executed under the protection of at least two barriers for each potential flow path. BEs are a subset of WPSI and include failed or missing barriers.
Barrier Events occur when a well’s physical barrier is lost, leaving only a single barrier remaining, e.g. BOP acting as a barrier following a kick.
Personal safety and process safety are distinct, yet both important to the attainment of a workplace that is free of incidents and injuries.
References:
- API RP-754 Process Safety Performance Indicators for the Refining & Petrochemical Industries
- A GUIDE TO MEASURING HEALTH & SAFETY PERFORMANCE , Health and safety Excutive HSE December 2001
- International Association of Oil and Gas Producers (2011) – Process safety – Recommended Practice on Key Performance Indicators
- Shell_Qatar PS Forum Feb 2013
- Progress on Process Safety Indicators ‐ Necessary but Not Sufficient? Peter Wilkinson


