Measure your safety performance

Safety hasn’t traditionally been measured in a comprehensive manner. Instead, the focus has been on a few select metrics, such as incidence rates and workers’ compensation expenses.
For safety metrics to truly drive performance, the big picture needs to be evaluated. For example, if your job performance was measured only by whether or not you came to work regularly and on-time, you could meet the measured criteria, but you might not be very productive, and no one would be the wiser.
Safety’s scope is vast. But many stakeholders who are not safety professionals do not see safety in such a broad way. They see it as “no injury = good; injury = bad,†and that’s where it ends. This is one reason why incidence rates and workers’ comp costs have snaked their way to the forefront of safety metrics. But as a safety professional you know what’s involved in obtaining the “no injury = good†atmosphere.
A few common components of effective safety programs/processes include:
- Management commitment
- Employee participation
- Training and education
- Compliance
- Hazard prevention/control
- Culture
- Incident investigation
- Evaluation/review
Matching the metric to the process
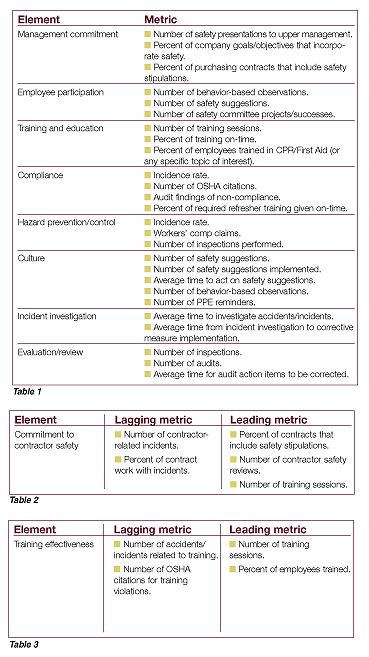
OK, what metrics can drive these program/process elements? Consider the elements and metrics in Table 1.
Remember, no single metric is suitable for every company. Each company has its own approach to safety, its own data collection systems, its own regulatory requirements, its own customer demands, etc. And each company has different audiences (upper management, customers, the public, etc.) requesting or using the safety metrics.
Types of metrics
As indicated in Table 1, many measures are available for the safety professional. So which do you need to use? Fortunately, metrics can be grouped into two categories: lagging indicators and leading indicators.Lagging indicators: These measures of safety performance come after the fact. For example, to determine how your safety process is doing, you might choose to look at your incidence rate. But without an actual incident, you really have no metric.
You could argue that “no incident†is a metric revealing a high level of safety. But you can also argue this metric doesn’t indicate much of anything. Was there underreporting? Near-misses? Is it a coincidence?
Even if the lowered incident rate reflects better safety performance, the rate alone doesn’t tell you what worked to improve the rate. Was it increased training? Engineering controls? Employee safety suggestions? New incentive program?
Don’t dismiss the value of lagging metrics. But you also need to look at leading indicators — activities that keep an incident from ever happening, or that identify problems before they become serious.
Leading indicators: With leading indicators, such as percent of departments conducting self-inspections, number of safety committee meetings, etc., you look at activities — positive activities — that occur before and independent of a negative event (accident) ever occurring.
Get a good mix
It’s probably best to pick a mixture of leading and lagging indictors. For instance, if you want to measure your commitment to contractor safety, focus on the metrics listed in Table 2.A similar approach can be illustrated for measuring training effectiveness, as shown in Table 3.
Choose a variety of metrics to get a better — and broader — view of your performance. And choose measurements that mean something to you or your organization — don’t just measure for measurement’s sake. Just because something can be measured, doesn’t mean it will be a useful measurement for your organization.
SIDEBAR: How to measure
Once you’ve determined what to measure, the next challenge is determining how to measure. Some common ways to measure include:
- Direct observation of conditions/behaviors (inspecting, monitoring, etc.)
- Surveying employees (perception surveys, conversations, etc.)
- Analyzing reports and records (often calculating percentages, totals, etc., or comparing to past reports or records)
Looking for a reprint of this article?
From high-res PDFs to custom plaques, order your copy today!


