Traffic deaths: A surprising dimension of the red state-blue state divide
Posted with permission from FairWarning.org:
The nation’s red and blue states often are miles apart in social attitudes and, of course, political outlook.
It turns out that they also divide into distinct camps when it comes to a grimmer measure — fatal traffic accidents.
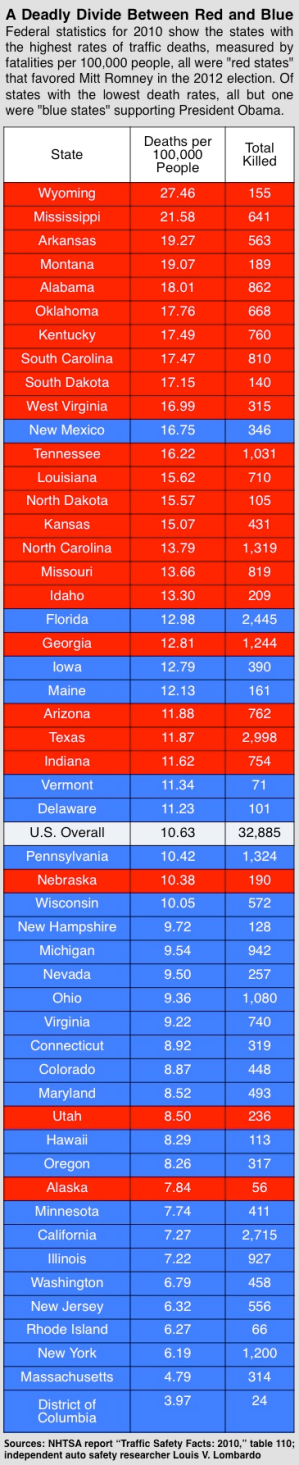
To an extent that mystifies safety experts and other observers, federal statistics show that people in red states are more likely to die in road crashes. The least deadly states – those with the fewest crash deaths per 100,000 people – overwhelmingly are blue.
In the absence of formal definitions for red or blue states, we labeled as red the states that favored Republican presidential candidate Mitt Romney, and as blue those that supported the reelection of President Obama.
The 10 states with the highest fatality rates all were red, while all but one of the 10 lowest-fatality states were blue. What’s more, the place with the nation’s lowest fatality rate, while not a state, was the very blue District of Columbia.
Massachusetts was lowest among the states, with 4.79 road deaths per 100,000 people. By contrast, red Wyoming had a fatality rate of 27.46 per 100,000.
When shown the pattern, author Thomas Frank — who has examined the nation’s political culture in such books as “What’s the Matter With Kansas? How Conservatives Won the Heart of America” – called it “amazing.”
“This is someplace where you would not expect to see a partisan divide,” Frank said.
Even the former federal auto safety researcher who brought the numbers to FairWarning’s attention, Louis V. Lombardo, couldn’t explain them. “It may be something we don’t have a definitive answer for,” he said.
Some observers offered the possible explanation that blue states tend to adopt stronger safety laws, while red states opt for looser regulation, presumably leading to more fatalities. For example, red Texas last month opened a toll road with a speed limit of 85 mph, the nation’s highest.
But the sweeping generalization doesn’t hold up under scrutiny.
For one thing, federal pressure in many cases has prodded states to enforce similar safety rules, such as seat belt requirements. And states don’t always act along predictable liberal-versus-conservative lines. As FairWarning has reported, blue Michigan in April repealed its requirement that all motorcyclists wear helmets, while some states with the toughest helmet laws are in the Deep South.
Traffic safety experts generally suggest that a mix of factors accounts for the varying rates. Possible variables include access to top-level trauma centers, weather conditions and how much of a state is rural, because rural residents may drive longer distances on narrow, winding roads. Lower income and education levels may also contribute to higher death rates.
“No matter how you look at fatal crash rates, there are some important things that explain why states are different, and they’re not political explanations,” said Anne McCartt, the senior vice president for research with the Insurance Institute for Highway Safety.
Complicating things further is the possibility that deaths per 100,000 residents isn’t the best yardstick for comparisons. Fatalities per total miles traveled, some experts say, is better.
For his part, Lombardo says he’s less interested in the causes of the state differences than in reducing the toll of U.S. traffic deaths, estimated at 32,885 in 2010.
For instance, he advocates getting crash victims medical treatment more quickly by expanding air ambulance services.
The key question, Lombardo added, is “how do we move the people, and [have] the people then move their politicians, to do the right thing?”
If he needs evidence that at least some parts of the country can do better, Lombardo can point to the striking red-blue divide in the accompanying chart.
About FairWarning
FairWarning (www.fairwarning.org) is a nonprofit, online news organization focused on issues of safety, health and government and business accountability.
Looking for a reprint of this article?
From high-res PDFs to custom plaques, order your copy today!
 FairWarning Assistant Editor Stuart Silverstein is a veteran reporter and editor who worked on the business, metro and national news staffs of the Los Angeles Times. He covered, among other beats, organized labor, economics and higher education. During his 32-year newspaper career, Stu also worked for dailies in Dallas, Atlanta and Buffalo. Stu has taught business journalism at USC. When he isn’t chasing stories, Stu enjoys seeing foreign films, studying foreign languages, working out and swimming. And he is interested in anything having to do with his hometown, Buffalo, N.Y.


