Avoid the trap of thinking we’re working “safe enough”
A matter of luck
Most times something bad doesn’t happen when we cut corners, so it is easy to fall into the trap of thinking that we are working “safe enough.” We need to focus our attention on being good instead of lucky.
Most businesses track, monitor, evaluate, and even agonize over lagging indicators -- representing what happened, after-the-fact, reactively. OSHA rates are commonly accepted to be the easiest measures for determining the condition of safety in the workplace and your status compared to other companies.
But a facility’s OSHA rates may not accurately and comparatively reflect its true safety performance. A method exists to better reflect what is really happening in the workplace. A safety professional performs two additional analyses: 1) a Severity Analysis and 2) a Luck Analysis.
Analyzing severity
Here you need to define and apply standard levels on the outcomes from workplace incidents, qualified and quantified by the pain and discomfort experienced by the injured and impact on workplace productivity.
The Severity Analysis Table (below) can also be used to decide which near miss/hit or close call incident should be formally documented and analyzed.
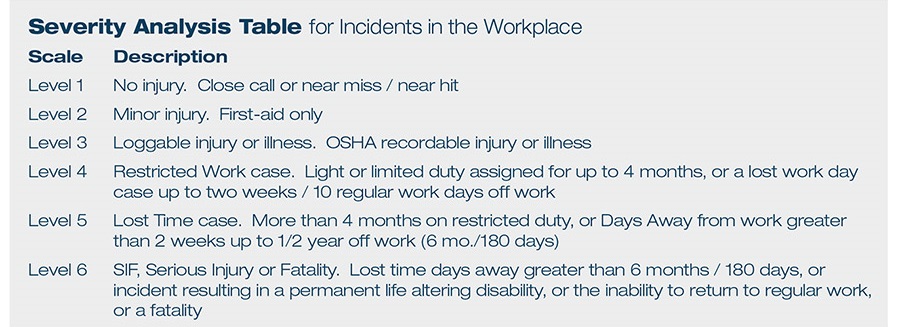
If the no harm incident had the potential to be a Level 3, it should be something deserving investigative actions as if it produced a harmful outcome.
If the no harm incident had the potential to be a Level 4, it should be something deserving a Root Cause Analysis (RCA), with lessons-to-be-learned and corrective actions to prevent recurrence.
If the no harm incident had the potential to be a Level 5 or higher, it should be something deserving an RCA involving company-wide communications on lessons-to-be-learned, an “extent of condition” review along with corrective actions to prevent recurrence, logged and tracked as a potential SIF (Serious Injury or Fatality) case.
Analyzing luck
Use severity analysis definitions and look at the most probable severity, if the incident were to be described as “unlucky.” Unlucky can be viewed as the most realistically expected “worst case,” because unless the worst thing actually happens, there is a "lucky outcome.” All near misses and close calls fall into the “lucky” category.
Luck analysis can reveal a more representative picture of one’s safety performance.
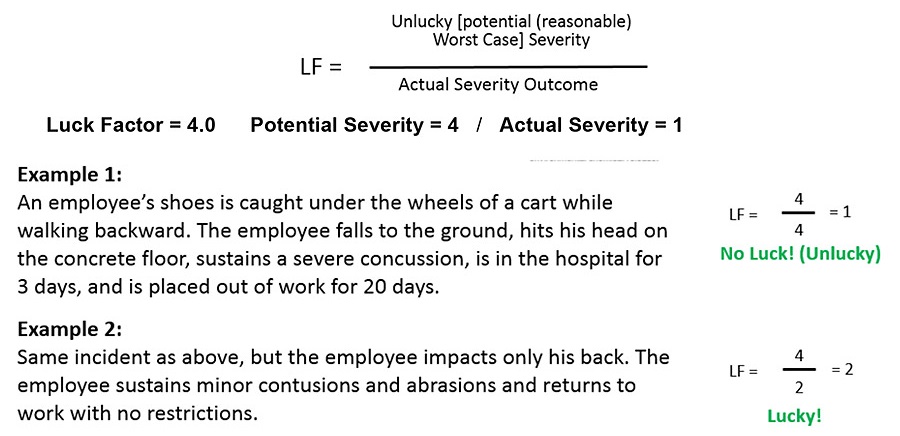
Categories: Unlucky = Less than 1, No Luck = Equal to 1, Lucky = Greater than 1
Closer to “1” the better, because it means you’re relying less on luck.
Cumulative “Luck”
Caution: If potential results are understated, skepticism can creep into the equation and discount the validity of the analysis and undermine recognition and acceptance of possible adverse trends.
Caution: When conducting this analysis, take care not to over-state the potential outcome. A slip and fall could potentially result in death, but it’s a typically experienced outcome.
Caution: Keep in mind that this is simply an informational tool.
Caution: If management starts counting the number of close calls and uses this as an indicator of better or worse safety performance, expect the total to go down.
Learning from experience is most effective, while measuring for the wrong reason will compromise learning.
Trending performance
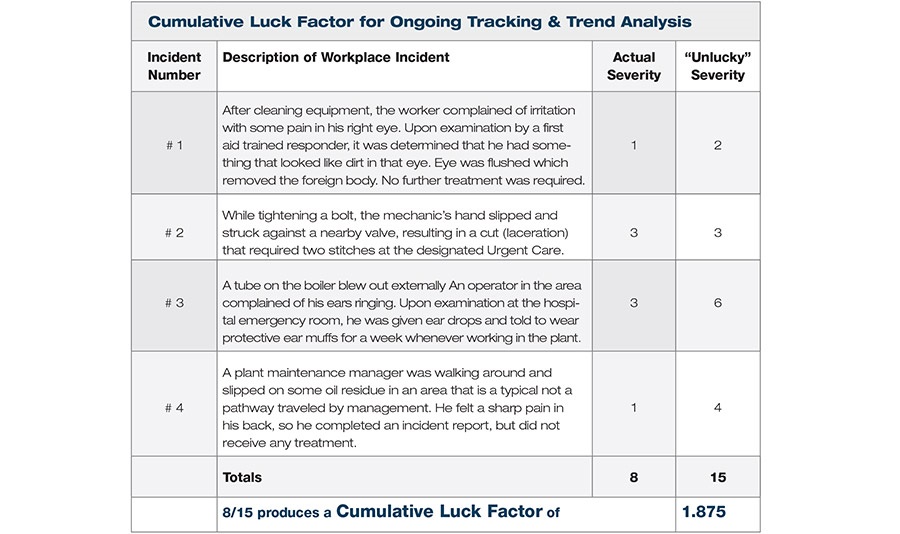
A cumulative luck factor is computed by adding the actual severity column and unlucky severity column for a number of recent events, per week / month / quarter. Divide the total for unlucky by the total for the actual, as shown in the table as shown in the table to the left.
Track by graphing the Cumulative Luck Factor average by week / month / quarter to monitor trends and answer the question: Are we getting better or just been lucky?
Looking for a reprint of this article?
From high-res PDFs to custom plaques, order your copy today!


